Will the Bull Stumble in 2014?
By Michael P. Abboud
With the S&P 500 beginning the year with the worst January performance since 2009 by declining 3.5 percent, the market then shifted dramatically to turn in its best February performance since 1998, rebounding by 4.3 percent, to close at a record high. The S&P 500 performance for March, while still volatile, has been relatively flat. Bond markets have also exhibited volatility with yields zig-zagging downward since the beginning of the year.
The volatility experienced year-to-date in both equity and fixed markets is reflective of current Federal Reserve policy whereby the Fed is tapering or reducing the amount of bonds it purchases every month. Historically, whenever the Federal Reserve has begun to unwind an accommodative policy stance, higher market volatility has ensued. While higher volatility is customary at this stage of an economic recovery, it does not necessarily mark the end of a recovery.
However, the late January to early February correction for the S&P 500 of approximately 5 percent is unlikely to be either the last or largest correction of 2014 if history is any guide.
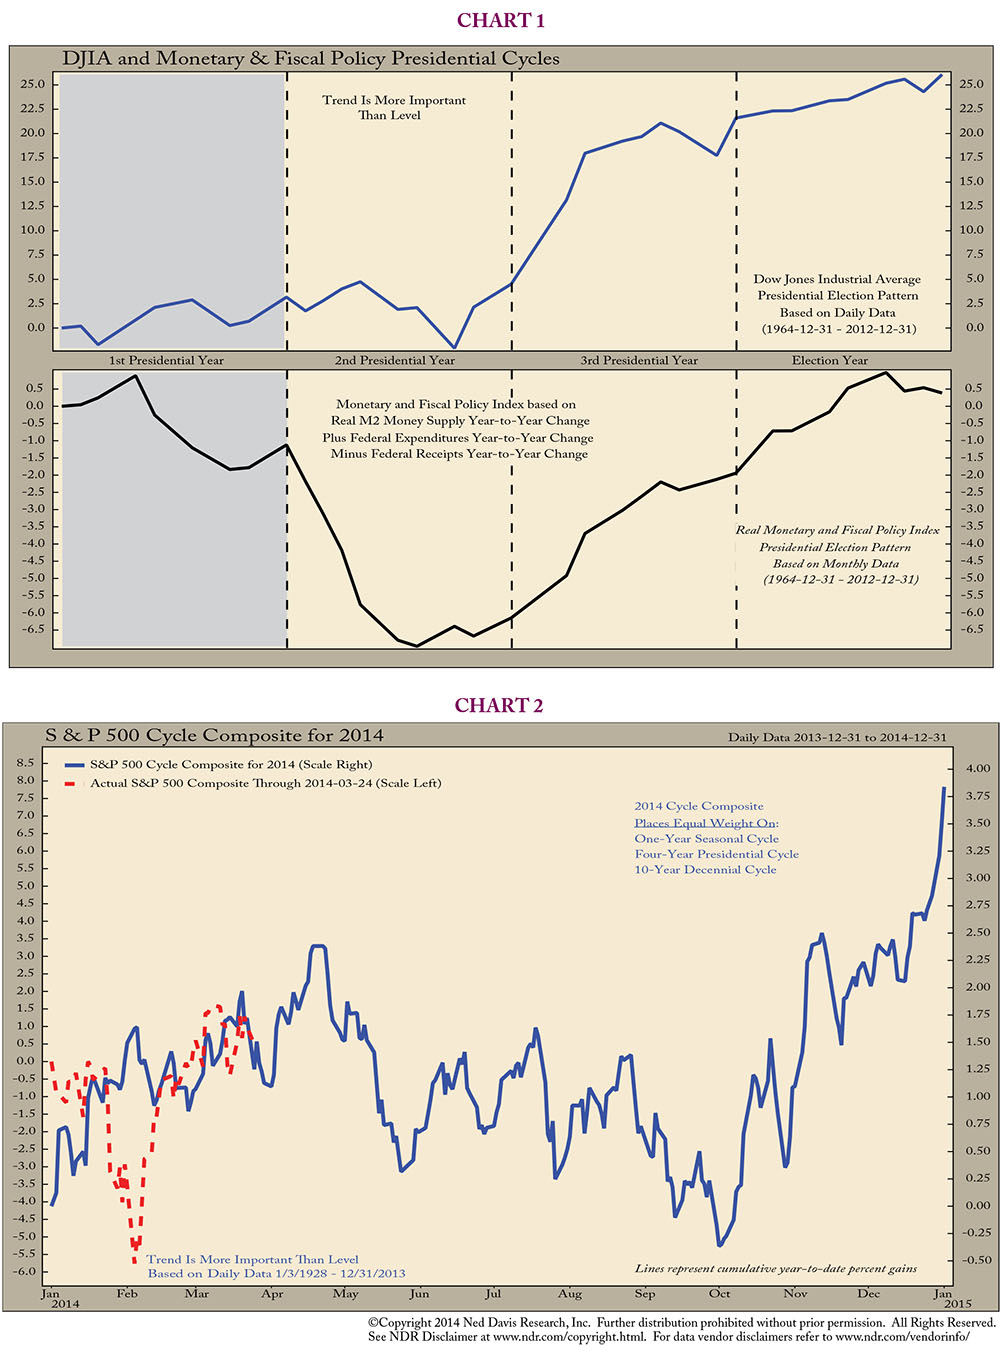
During the 5 percent correction experienced this quarter, a question that surfaced with increasing regularity was whether this correction was the beginning of something more ominous. An answer to this question is provided by viewing the stock market in terms of presidential years relative to monetary and fiscal policy based upon almost 50 years of data (see chart 1). As illustrated by the chart, the second year of a presidential term (or mid-term year) has been the weakest year (top clip) of the four on average as the market adjusts to tighter fiscal and monetary policy (bottom clip).
Presently, the combination of fiscal and monetary policy is the most restrictive it has been since the beginning of the financial crisis in 2008. In addition to the mid-term year of a presidential cycle being the weakest, this year is also associated with the highest probablity of a meaningful correction. However, when a mid-term occurs during a bull market, the average mid-term year pullback is approximately 14 percent versus 20 percent if the mid-term occurs during a non-bull market, based on data going back to 1928.
As to when a correction of this magnitude may occur, a composite cycle for the S&P 500 may answer this question (see chart 2). The graph shows that the performance of the S&P 500 year to date (red line) has thus far tracked what the cycle composite predicts for how the S&P 500 will perform this year. Analysis of this chart indicates the old market adage “sell in May and go away” may yet again ring true this year with regards to when the correction begins.
Viewing historical stock market results during mid-term election years within the context of today’s bull market provides additional insight as to the stock market’s future direction. Today’s bull market advance and length compared to the median bull market since 1928 has thus far gained 62 percent more and is 10 months longer in duration than the median bull market. Historically, when bull markets reach their fifth anniversary, as this market did in early March, the market has on average produced another 26 percent in gains, if the bull market survived for another year.
As we come to the end of the first quarter for 2014 and enter the fifth year of the bull market, a natural question to ask is: what would end the bull market run, given the state of the markets and economy as we understand them today?
One of the possible threats to the bull market in recent weeks has been possible contagion from either the selloff in emerging markets or the unrest in the Ukraine. While the markets initially reacted to these developments in the first quarter, they eventually became complacent and shrugged off these impacts. This reaction is in line with the market behavior after every mini crisis since the onset of the financial crisis in 2008. Every dip in the S&P 500 due to Greece, Italy, etc. or every monetary policy decision, fear of a hard landing, or Washington standstill was a dip to be bought.
What really matters to the continuation of the current bull market is the outlook for economic and earnings growth in 2014. Due to harsh winter weather, near- term economic trends have been below expectations, but domestic spending should resume its vigor after this quarter and the US economy should grow at 2.8 percent for all of 2014 based upon consensus forecasts. Corporate earnings as measured by the S&P 500 should also continue to grow, increasing just over 8 percent this year, based upon consensus forecasts. Given the unprecedented 20 straight quarters of aggregate free cash-flow generation, corporate balance sheets have approximately $2 trillion in cash as of the end of 2013 to aid the economic recovery by investing and hiring additional employees.
As the first quarter of this year draws to a close, the bull market should continue based on continued economic growth. However, do not be surprised to see the bull stumble with a correction sometime over the next few months before resuming its upward trend for the remainder of the year.


