A Tale of Two Halves
By Cameron Turner
We were in the midst of March Madness when I realized the first quarter of 2016 was like a basketball game for the markets, comprised of two unique halves.
A turbulent start characterized the first half of Q1. The S&P 500’s 8% decline over the first 10 trading days of 2016 was the worst start to a new year the index has ever experienced (the index began in 1928). Besides the big drop, January 2016 will be remembered for its amazing volatility. Out of the first 18 trading days this year, 12 moved at least 1% up or down. This is the longest run of 1% moves since October 2014, when we saw 12 moves up and down.
On top of that, there was no shortage of things to worry about. The geopolitical picture hasn’t been great and the risk of instability has increased. Concerns over China’s growth and fiscal policies, European bank struggles, emerging economies’ policies and the Bank of Japan’s surprise shift to a negative interest rate weighed on the market. Closer to home, continued cutbacks in the energy sector, including several companies slashing sacred dividends, a sluggish economy, and increasingly tighter financial conditions all weighed on investors’ minds. All of these fears caused many to ask if a global recession was looming.
Since the middle of February, many of these concerns have begun to ease and the second half of our figurative basketball game looked more promising for our team than the first. Oil dropped below $27 in the middle of the month and has since moved close to $40 a barrel. The Fed has “tapped the brakes” on interest rate hikes as the market anticipated 2-4 rate hikes in 2016 and is now anticipating somewhere around 2 for 2016. U.S. manufacturing even showed signs of life with a relatively strong February number.
It appears the most important driver for the economy and further resiliency for 2016 is the U.S. consumer. Some of the reasons behind the well supported consumer spending are: stronger employment, income, housing, lower energy prices a higher savings rate and a strengthening consumer balance sheet. More on this last topic on page 2.
Employment and Wages
To have a strong consumer, an economy needs a strong labor market. For all of 2015, the U.S. added 2.65 million jobs, capping a two-year, back-to-back gain that was the best since the late 1990s. The economy has created over 10 million jobs since 2009. The robust job growth has continued into 2016, adding 242 thousand work positions in February. After the February report, the unemployment rate held a cycle low of 4.9% (its peak was 10% in 2009). The U6 unemployment – a broader measure of unemployment that includes workers who are part-time purely for economic reasons – fell 0.2% to a new cycle low of 9.7% (its peak was over 17%).
There are more reasons to celebrate on the jobs front. The labor force participation rate – which measures the share of Americans at least 16 years old who are either employed or actively looking for work – climbed 0.2% to 62.9% in February. Yet, the unemployment rate did not rise. It is a good sign that people are returning to or joining the labor force and getting jobs at the same time. More people who had dropped out or delayed their search are looking again as the opportunities have improved.
Another aspect of the employment picture is wage growth: Wages fell 0.1% in February, a disappointment after January’s promising 0.5% increase. This put the yearly growth in wages at 2.2%, only modestly ahead of the inflation rate. Wage growth has held just above 2% since the expansion started in the middle of 2009. Typically, wage growth leads to higher inflation. Therefore, wage growth is watched closely by the Federal Reserve.
Strong Consumer
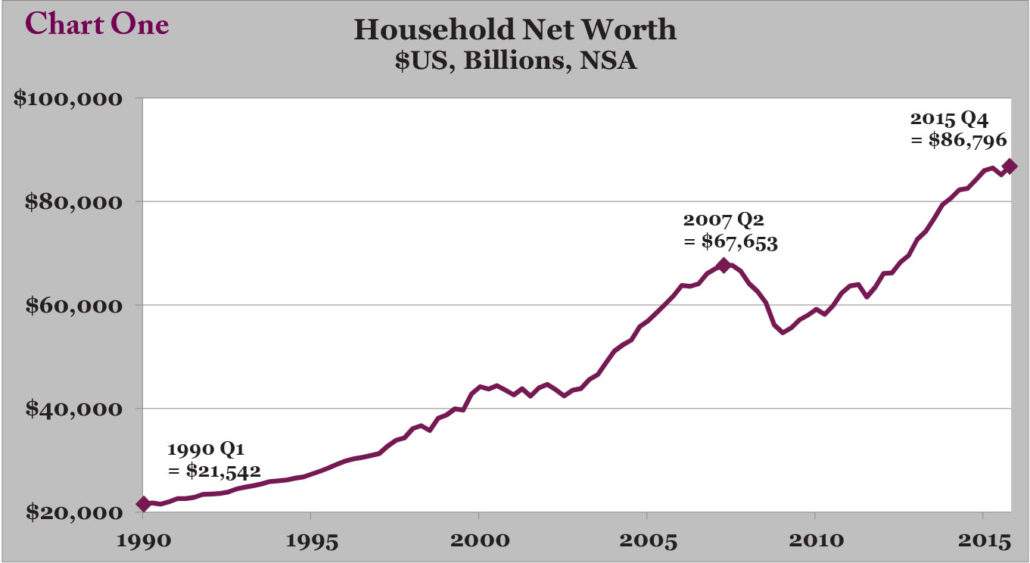
The U.S. consumer has a strong footing. Investment portfolios including 401ks have experienced a nice rebound from the 2008-2009 market crash. Also, home values have appreciated at a nice pace and household net worth has seen a nice rebound.
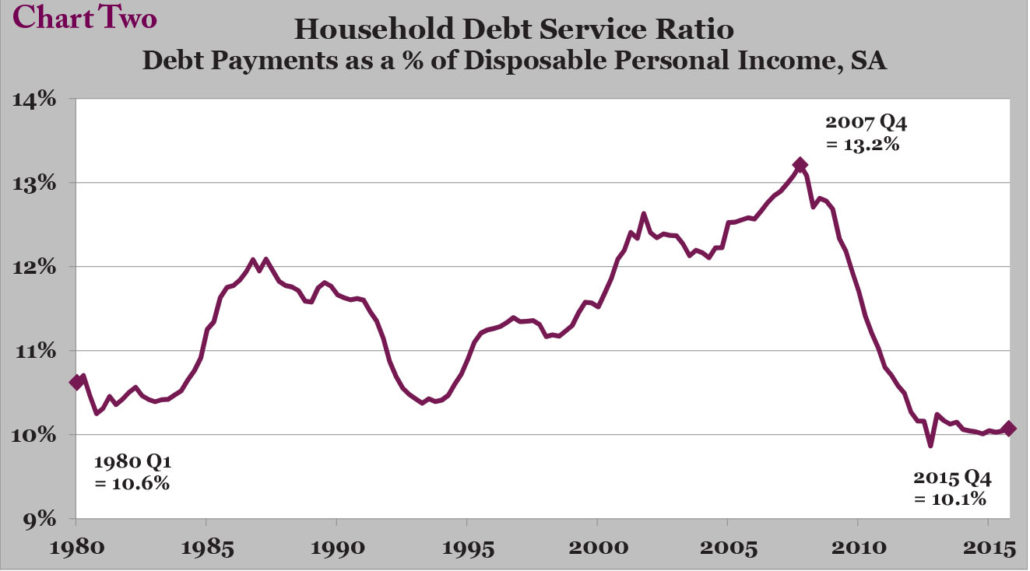
As you can see from Chart One, household net worth is 28% above the prior peak reached in 2007. In addition, household debt payments as a percentage of disposable personal income are 24% below their peak (Chart Two on the next page). U.S. households built up a massive debt load as the housing bubble expanded. Efforts to pay down these debts have been a restraint on spending, and are one of the reasons this recovery has been milder but has lasted longer than the typical recovery. As the consumers’ debt service ratio has improved as a result of paying down debt, lower interest rates, along with a strong employment situation, and rising income levels, well-positioned consumers should in turn boost spending.
Keep in mind that consumer spending accounts for more than two-thirds of U.S. economic activity. For an economy to grow, it is vital to have strong consumer spending on goods and services. Clearly, an improved employment picture with more people working and earning higher wages helps with spending within the economy. In recent months, we also have an extra factor: low gasoline prices also provide consumers more monthly income to spend. It is estimated the average U.S. household saved $660 in 2015 from lower gasoline prices.
Auto sales and housing are two areas where we have seen some strength in consumer spending. In 2015, U.S. auto sales hit a record of 17.47 million vehicles, breaking the mark of 17.41 million vehicles sold in 2000. Aided by low-interest rates, the housing market has seen a nice improvement and has shown relatively steady growth since 2011.
Where do we go from here?
We have seen a nice rebound in the markets since the mid-February lows, but all of this positive momentum has just pushed us to the approximate break-even point for the year in the S&P 500. Throw in an “exciting” election along with monetary, political, and regulatory uncertainty, and the volatility we have seen over the past nine months does not appear to be going away. The instability of oil prices will also be a factor moving forward.
However, as a result of low but stable economic growth, expected earnings improvement, and a financially stronger U.S. consumer, the score at the end of our Q1 basketball game reflects equities ultimately moving higher, albeit at a tempered pace.


