Multi-Coping
By Bob McCormick
If the early scrum of the presidential campaign doesn’t hold your attention, you can fight the summer doldrums by starting an argument between two economists. Just offer up this quote:
“Nothing has been more central to America’s self-confidence than the faith that robust economic growth will continue forever…Unfortunately, the evidence suggests to me that future economic growth will achieve at best half that historic rate.”
When economist Robert Gordon wrote these words in the Wall Street Journal in December 2012 he caused quite a stir. Other economists, politicians and tech executives promptly took sides.
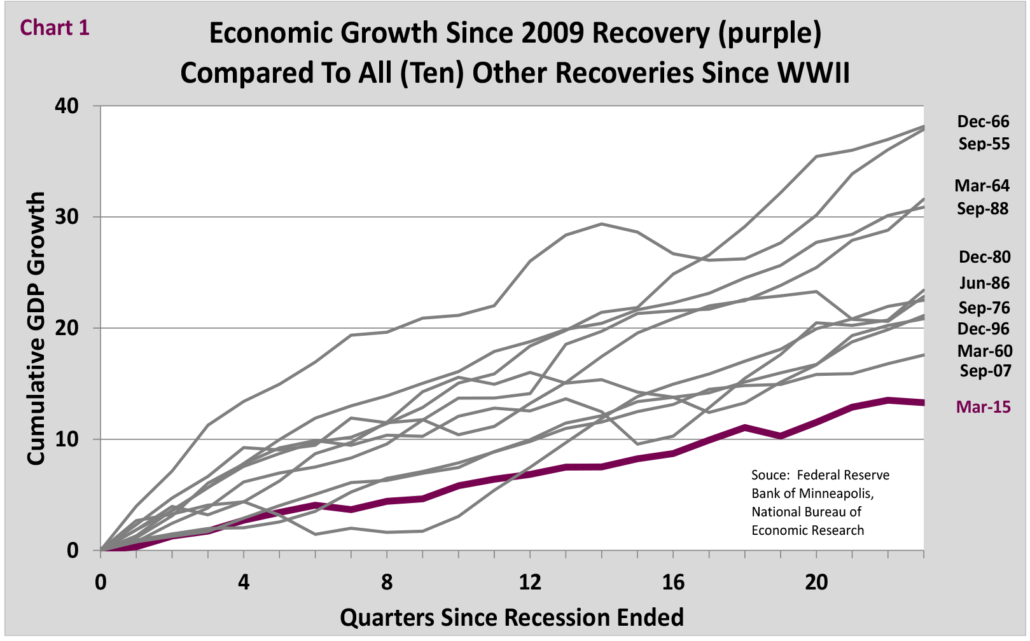
The fact of the matter is we have been coping with the slowest recovery since WWII (see Chart 1). But Gordon was specifically talking about how fast the economy grows due to productivity gains. From this perspective, the economy can grow in two ways: first, more people working more hours; and second, workers producing more given the same hours worked previously. Over time, strong economic growth is driven by productivity gains and the increased productivity comes from innovations boosting output and not simply working harder.
Large productivity gains are the payoff from industrial revolution-type achievements in which visionaries have risked everything in the arduous development and commercialization of innovations. The steam engine, electricity, indoor plumbing and the computer/internet are examples that greatly benefited society and led to higher living standards worldwide.
Innovation Everywhere, Except in the Numbers
The most controversial part of Gordon’s argument is that most of today’s innovations pale in comparison to those of past eras. Recent technologies help us in many ways, but they are more incremental and not game changers. And they often focus on comfort, not productivity. To summarize his example, assume you can keep your 2002 technology and choose either indoor plumbing or all of the tech advancements since 2002: Ipads, Facebook, Twitter and the like. Which option are you going to select? This comparison may be unfair as it can take years for an innovation to show results. But for those who choose to forego indoor plumbing, please stand downwind.
Gordon’s assertions might have ended up a forgotten footnote except for one thing: he has been right so far, at least about productivity. Since 2012, productivity growth has averaged a mere 0.5% per year through March 2015 – a fraction of the 3% average annual gain experienced from 1996-2005 when widespread adoption of the internet drove growth upwards. Without more workers collectively working more hours, economic growth would have been close to flat since 2012. That’s a shortfall one could drive a fleet of Uber cars through. If current advancements are truly game changers, they are not showing up in the official numbers yet.
We find ourselves in a slow-growth economy that does not have easy or fast fixes by Gordon or anyone else. Part of the puzzle is that we face a demographic headwind of an aging population that is barely growing. In fact, without immigration, our population would actually be shrinking as the national birthrate has dropped no-ticeably since the 2007 recession. With near-flat productivity and population growth, it follows that eco-nomic growth is weaker than in the past.
Yet, we are still in much better shape economically and demographically than most other developed countries – the cleanest dirty shirt, as they say. History is also well documented with a chorus bemoaning the future, only to be surprised by a “doer” in a garage who is too busy to listen. Naively optimistic? Perhaps, but we have faced worse conditions, much worse in some cases. The 1930’s experienced a near-fracturing chain of events, but also witnessed significant technological innovations.
I was thinking about our current challenges after attending a gathering where the presenter patiently explained to the group that people cannot effectively multi-task regardless of age, gender or job title. We can only focus well on one task at a time and task-time isn’t measured in seconds. Our personal productivity is greatly diminished as we jump back-and-forth between “to-do” items, especially as we try to use different parts of our brains along the way.
It would seem a better description of our too-common mode of daily operation is multi-coping. We cope, but do we complete? Layer on the electronic distractions of a flood of useless emails and social media hypnosis and, well, where has the day gone? It makes you wonder just how much “actual thinking” or “true doing” our connected society does at times. Now, I am not suggesting that all of these wondrous apps on our smart appliances are actually bringing down our collective productivity as opposed to raising it up, but if this struggle resonates with you, please email this article to 20 other people, “like it” on Facebook and give it a shoutout on Twitter.
Coping With Valuations
Investors have other things to cope with these days such as a Fed seeking a way to end its zero interest rate policy and a market that has climbed upwards for 45 months without even a 10% correction. One other item of concern for investors, which cannot be ignored, is equity valuations. To over-generalize, absolute measures of valuation such as price/earnings (P/E) appear full to high, depending upon how far back you want to make the comparison to today’s levels. When these same valuation measures are compared relative to current low interest rates (and inflation), they often appear reasonable; again depending upon how far back you want to go to make the comparison.
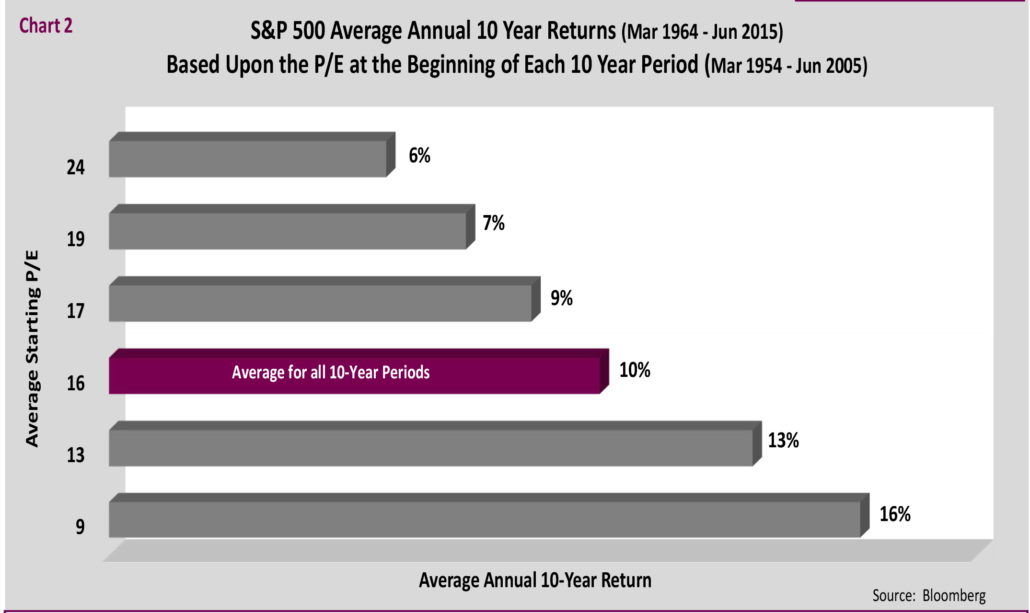
While valuations are a poor short-term market timing tool, they are better than almost all other tools at forecasting long-term equity returns. Buying stocks cheap (low P/Es) has usually led to better than average returns. And when P/Es are high (expensive), future returns tend to be low.
See Chart 2 below for a long-term perspective regarding this trade-off between valuations and subsequent stock market returns.
Historically, when starting P/Es are low, future returns tend to be high. When starting P/Es are high, future returns are usually low. Each of the five gray bars represent one-fifth of all P/Es since March 1954, from highest (top bar) to lowest (bottom bar). Over this entire period, the average P/E was around 16 and returns averaged 10%. Today, the S&P has a P/E of about 18.
On Dec. 31, 2000, near the top of the tech bubble, the S&P 500 carried a P/E of 24, quite high by historical standards. Since that date, the average annual return was roughly 5% through June 2015 – half what most investors probably consider normal. Today, the P/E is around 18; not nearly as high, but still above its long-term norm of 16.
Investors might recoil at the chart’s implied future return of mid-single digits based upon a P/E of 18. Then again, the current 10-year U.S. Treasury yield of 2.4% is low versus the past as well. If equities do perform in line with the historical averages shown on this chart, future equity returns will be close to normal relative to current bond yields. Now I can cope with that.


