What Is ‘Normal’ Now?
Inflation, the Market, and the Economy: Reviewing an Unusual Year to See What’s in Store for 2022

If you had hoped 2021 would mark a turning point in the return to normalcy, you now probably find yourself disappointed. What is “normal” now? It seems harder to define than it was prior to the pandemic and recession of 2020. This is the case for not only families, but also for professionals, economists, market strategists and beyond. Does the market seem normal at this point? Does the economy seem normal? Both are good questions.
Last year began full of promise. Vaccines from major pharmaceutical companies were expected to put the proverbial nail in the coffin on one of the fastest but deepest recessions in modern history. While not all Americans elected to receive the vaccine, most did and it spurred a return to normal for many. Children returned to school in droves. Professionals dressed themselves up fully (rather than just waist-up) and left the confines of their homes to return to their offices. Families actually celebrated holidays together rather than in a Zoom room. Seems normal enough, right?
A few things interrupted our journey to normal: delta variant, omicron variant, supply chain nightmares, semiconductor shortages, polar vortex, inflation, more inflation, declining labor force, and so on. As we enter 2022, let’s review the aspects of our economic environment that continue to stand out when compared with historical norms. Looking more closely at these factors can help us set expectations for the year ahead.
“Normal” Inflation
High on the scale of abnormal for 2021 is inflation. What is “normal” inflation? Historically it has been around 2% to 3% per year. Reviewing the Core CPI figure (which excludes food and energy, the two most volatile components of inflation), the median inflation rate has been 2.6% per year going back to 1958. Core PCE (a slightly different measure of inflation but one that also excludes food and energy) has a median rate of 2.2% per year going back to 1960.
The present Core PCE annual rate is 4.7%, a figure we haven’t approached since the late 1980s. We are well above normal in that regard. Yet, this is well below the high inflation of the late 1970s and early 1980s, when Core PCE approached 10% per year.
For 2022, the Fed has indicated that its voting members anticipate raising rates as many as three times. Each rate rise will likely equate to a 0.25% increase in the Federal Funds Rate, the rate that banks use to borrow money overnight from the Fed. Therefore, if the Fed were to raise rates three times, the Federal Funds Rate would increase by 0.75%. Such a rise would not occur all at once, and instead would likely occur in two or three separate instances over the course of the year.
The implications of rate increases are numerous. In an academic sense, raising interest rates should curtail inflation in the near-term. Additionally, if the Fed continues its plan to accelerate the tapering of asset purchases and even switches to selling assets, that too will help squash inflation.
There are a few notable side effects of this action. For instance, the rise in short-term rates will likely cause fixed income (especially short-term fixed income) values to decline. The math of a bond is generally such that rate rises and market values have an inverse relationship: a rise in one causes a decline in the other. However, high-quality fixed income holdings don’t experience volatility like stocks do. A decline in the price of fixed income from rate rises may be a few percent, whereas stock price volatility can exceed 40% in a calendar year (as it did in 2008). Additionally, the Fed raising rates is likely to create some market volatility.
“… the markets have provided some interesting twists and turns, with volatility at an extreme high. Volatility in the S&P 500 was higher than its 30-year average for nearly the entire year of 2020 and most of 2021.
“Normal” Equity Markets
The S&P 500 finished the year with a return of nearly 29%. In fact, the S&P 500 closed at a new record high approximately 70 times over the course of the past year. The year before, the S&P 500 returned 18.4% despite the pandemic, a recession and a midyear drop of approximately 33%. Is this normal?
On average, large-cap stocks have returned approximately 12% per year during the period 1926-2020. Comparatively, both 2020 and 2021 were significantly above-average years. That’s good news for anyone who has been invested in equities over recent years. In fact, the majority of the last decade has provided investors with returns well above average.
Along with these “inflated” equity returns, the markets have provided some interesting twists and turns, with volatility at an extreme high. Volatility in the S&P 500 was higher than its 30-year average for nearly the entire year of 2020 and most of 2021. More recently, volatility has been returning to normal levels; however, as noted above, the Fed raising rates is likely to lift volatility again in the future.
The dividend yield of the S&P 500 is near historic lows, presently around 1.3%. The last time the S&P 500 dividend yield was this low was March 2000, when the dividend yield was about 1.1%. Going back to 1970, the average dividend yield of the S&P 500 is approximately 2.8%, making our current levels well below normal.
There are several reasons for this below-average equity yield environment. First, prices have accelerated rapidly coming out of the 2020 recession and market downturn, but the dividends issued by corporations haven’t caught up quite as fast.
Also, cash dividends have fallen out of fashion. Increasingly, many companies have returned profits to shareholders in the form of stock-buybacks, whereby the corporation purchases its own stock in the market. While this is not “cash in hand” to a shareholder, it does effectively return profits to shareholders by making their slice of the corporate pie larger. With fewer shares in the market, existing shareholder shares represent a greater proportion of shares outstanding, and are thus entitled to a greater proportion of future earnings. As companies make this shift, the dividend yield paid through cash dividends is declining.
Lastly, the composition of the S&P 500 index has changed dramatically. The technology sector now represents over 29% of the index. Historically, technology companies have paid lower dividends than other sectors like energy and industrials as they divert more of their free cash flow to research and development efforts.
Another analysis of market “normalcy” comes from valuations. There are many different metrics for determining market valuations, but the most commonly used is the price-to-earnings ratio (“P/E ratio”), a fraction that measures how much each share of stock costs versus the corporate earnings that share is entitled to receive. Presently the P/E ratio is in the 25x to 26x range, meaning investors pay between $25 and $26 dollars for every $1 of S&P 500 earnings. Historically, that figure has been closer to the 17x to 18x range. On the surface, that would appear to make the market overvalued compared to normal; however, time periods following recessions tend to show spikes in this measure.
For instance, following the Great Financial Crisis, the P/E ratio of the S&P 500 jumped from 14.5x to 22.2x, from March to September 2009. In the aftermath of the tech bubble, the P/E ratio jumped from 21.6x to 27.8x from March 2001 to March 2002 (see chart below).
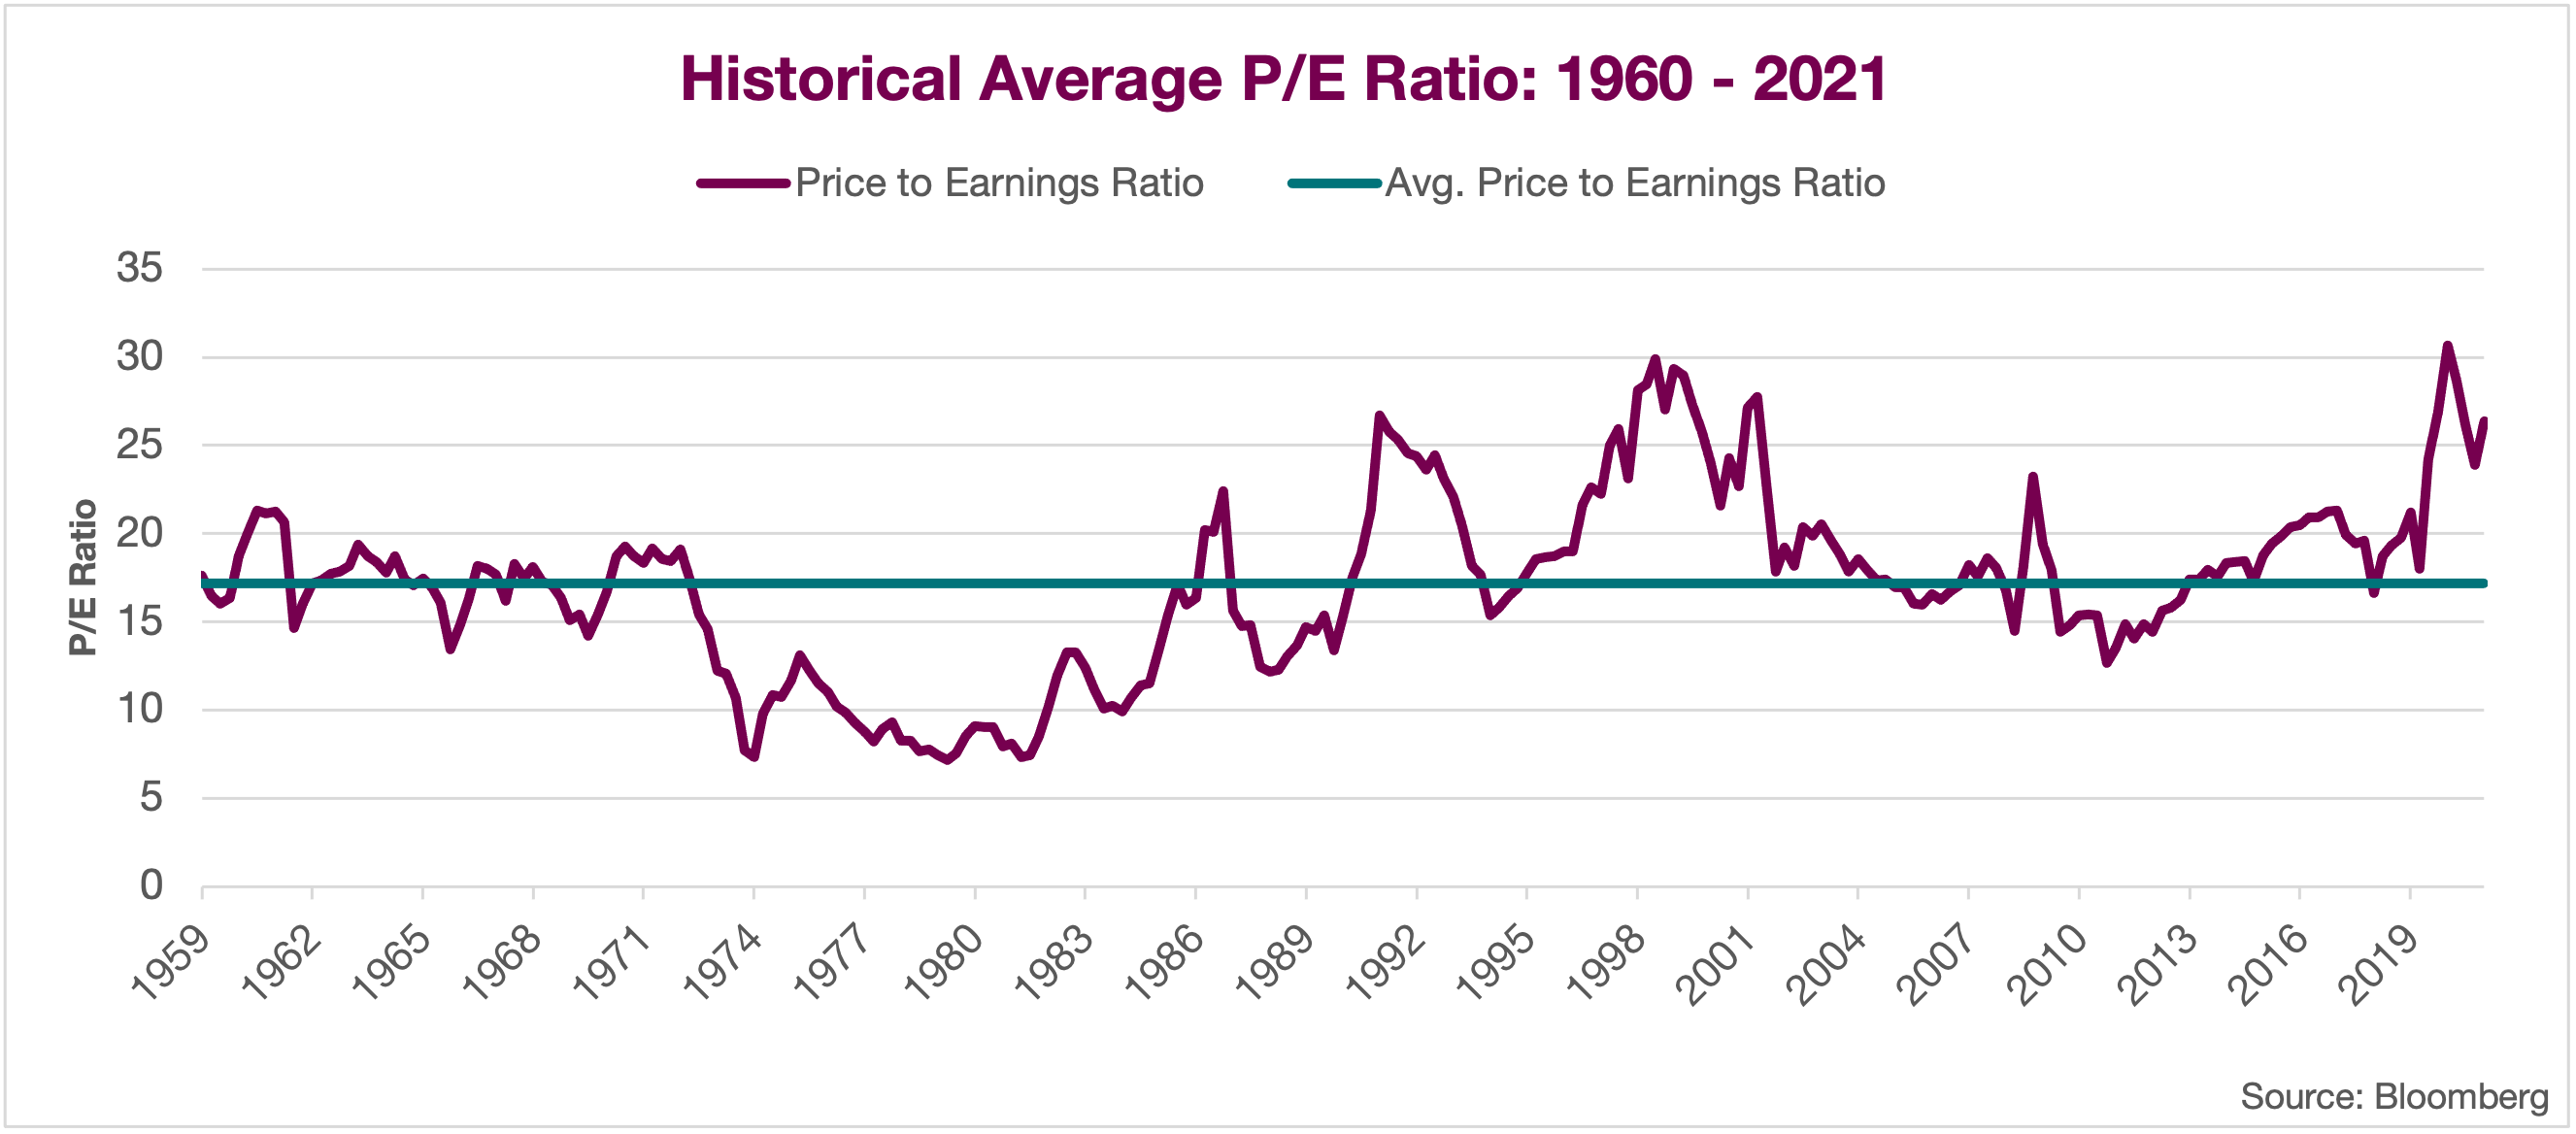
The reason is simple: Markets adjust faster than corporate earnings do. Investors see, anticipate, and act on the economic and market recovery long before that is translated into company earnings. This recovery is no different. The valuation of the stock market in relation to “normal” will be something to keep an eye on coming into 2022.
In 2020, consumer spending fell by 3.8% but was expected to rebound with 8.0% growth in 2021.
A “Normal” Economy
What is a “normal” economy? To answer that question, let’s consider GDP, housing, unemployment, and consumer spending.
In the post-World War II era, our Real GDP (Gross Domestic Product – a measure of our country’s total economic output) has averaged about 3% annually. Most years, it comfortably hovers between 0% and 6%. Comparatively, 2020’s change in Real GDP was -3.4%, the worst calendar year drop since WWII. Meanwhile, the change in 2021’s Real GDP is forecast by Bloomberg to be positive 5.6%, the highest since the mid-1980s.
Housing prices had an incredible boom in 2021. Is the housing market normal right now? Probably not. Buoyed by stimulus and motivated by historically low interest rates, homebuyers have invested heavily in real estate over the last 18 months. The result has been historic home price inflation. The S&P Case Shiller home price index is currently reading year-over-year national home price inflation averaging 19.5%, the highest reading on this index going back to 1988.
The unemployment rate is approaching normal levels once again. The headline unemployment rate in the U.S., technically referred to as the “U-3” rate, is 4.2%. This has come down considerably from a high of 14.8% in April 2020, which was the highest reading since WWII. Post-WWII, the U-3 rate has averaged 5.8%, which means the current unemployment rate is actually well below normal.
In dollar terms, consumer spending has surged in the last year, but some of that is distorted by the inherent impacts of inflation. Nonetheless, spending has mostly returned to normal, due in large part to the fiscal stimulus measures passed by Congress over the last 18 months. Spending on goods is actually above trend expectations, but spending on services remains subdued compared to pre-pandemic trends. Post-WWII, consumer spending has averaged about 3.3% growth per year. In 2020, spending fell by 3.8% but was expected to rebound with 8.0% growth in 2021. Bloomberg forecasts for spending in 2022 average 3.8% growth, which is still elevated but close to normal.
A “Normal” Year Ahead?
There are a number of challenges in the year ahead, some of which were discussed above. In light of these, what should we expect for the future? Here are some thoughts:
- We expect heightened volatility in both equity and fixed income markets.
- It is unlikely equity returns will be so far above average again. Though, we still expect positive equity returns. Most Wall Street banks are projecting positive but below-average returns for 2022. TCO projects 7% returns for the S&P 500 in 2022.
- Fixed income returns will also be below average, or even negative depending on how aggressively the Fed cuts interest rates. TCO forecasts 0.4% returns for the Bloomberg Barclays Aggregate Index (a broad U.S. fixed income index) in 2022.
- Inflation will subside slightly this year, but it will remain elevated compared to the 1.5% to 2.0% we’ve experienced over most of the last decade. Bloomberg inflation forecasts for 2022 presently average a 4.4% CPI inflation rate for 2022.
The point of all of this is that 2022 is likely to be another unpredictable, volatile year. I think in some ways life is always somewhat unpredictable and volatile. That said, I hope the coming year brings you a healthy dose of prosperity, joy, happiness and normalcy.

Philip D. Mock, CFA, CPA, CFP®
Executive Vice President & Chief Investment Officer
(918) 744-0553
PMock@TrustOk.com