Upside Down
Making Sense of the Recent Yield Curve
If you have been watching the business news networks, you have probably noticed that the stories often mention the inversion of the yield curve. In finance, the yield curve is a graph showing interest rates (also called “yields”) across different maturities (two months, two years, 20 years, etc.). The curve shows the relation between the interest rate and the time to maturity. See below for the current curve.
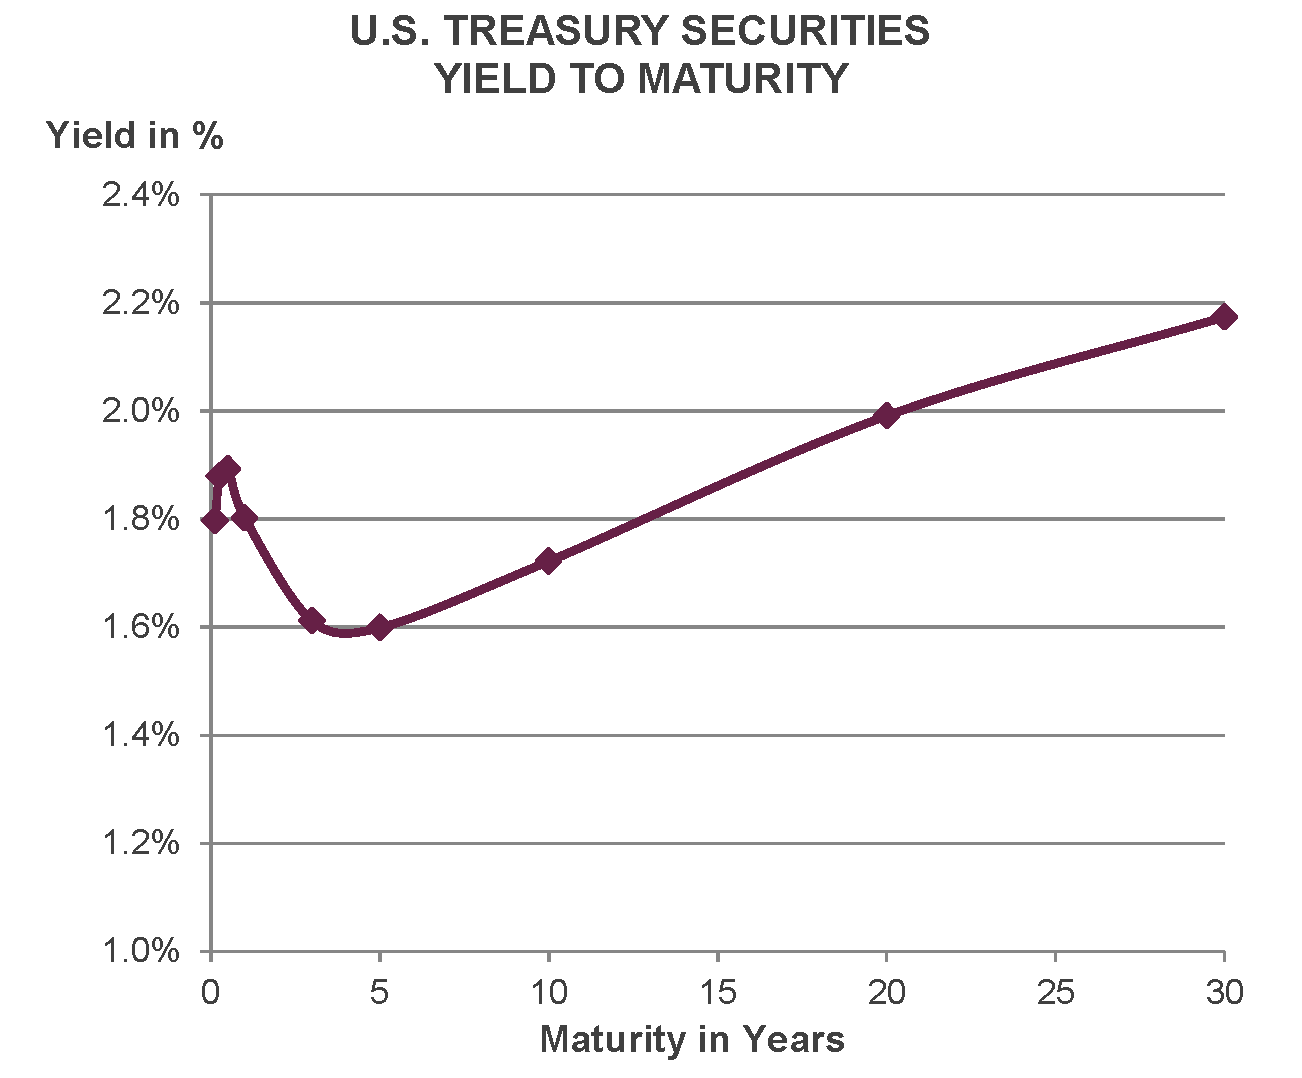
In late August, the yield on the 2-year U.S. Treasury Note was above the yield on the 10-year Treasury Note. Normally, yields are higher, not lower, as bond maturities get longer. This means the yield curve is usually upward sloping with the 2-year yield less than the 10-year yield. However, in certain market environments, the yield curve will invert with shorter dated bonds yielding more than longer dated bonds. These inversions are rare and sometimes just briefly occur before going back to normal conditions, leaving little cause for concern.
Is this inversion just an irrelevant incongruity or should we as investors adjust our portfolios accordingly? Let’s examine why inversions are anomalies and what they have historically indicated.
There are a few reasons why inversions are uncommon. Let’s begin with the concept of the time value of money. Longer term bonds typically earn a higher rate of interest because a dollar today is worth more than a dollar tomorrow. So, a dollar in two years is worth more than a dollar in 10 years. Why? Because there is an opportunity cost for tying your money up for 10 years as opposed to two years. To compensate investors for their time, a higher rate of interest is offered.
Additionally, there is the risk that inflation increases unexpectedly. Investors are usually more comfortable making an inflation forecast for the next two years as opposed to the next 10 years. For that matter, the further out an investor looks, the more varied the forecast because of the added risk of more volatility. Investors want to be compensated with a higher return for added volatility over longer time periods.
Inversions Matter
The markets view an inversion as a red flag, a recessionary warning. And rightfully so. An inversion has occurred before each of the last seven recessions. The reason some analysts are concerned about the most recent inversion is because this is the first such occurrence since the 2008/2009 recession. An inversion acts as a leading indicator, often before other economic indicators begin to show signs of a recession. Importantly though, an inversion has predated an economic recession by upwards of 22 months, so equity markets don’t always turn down just because yields invert. A lot of events and counter-vailing forces can occur after an inversion to prevent or delay a recession from occurring.
There is always the possibility that the recent inversion may be different than past inversions. Investors are currently in a unique climate following a first-of-its-kind policy of massive quantitative easing by the Federal Reserve and other central banks where longer term Treasury yields have been forced down by the Fed. This may be distorting the message an inversion normally sends and enabling more frequent yield curve inversions without the associated risk of recessions.
There is also pressure on U.S. yields due to weakness in foreign economies and their central banks’ aggressive policies. While U.S. rates are near historical lows, they are by no means the lowest on a global scale. Due to the U.S. having relatively higher interest rates compared to other developed economies, investors from foreign countries are purchasing large quantities of our bonds, thereby driving bond prices up and yields down. This foreign pressure has helped drive the 10-year yield to fall below the 2-year yield.
But Maybe Not So Much for Stocks
Regardless of whether or not the current inversion is signaling a recession, an equity investor attempting to time a recession using this inversion as a signal could easily lose out on significant returns. Not only can an inversion have a very long lead time in front of a recession, stock market returns have often been positive in the 12 months following an inversion (see chart below).
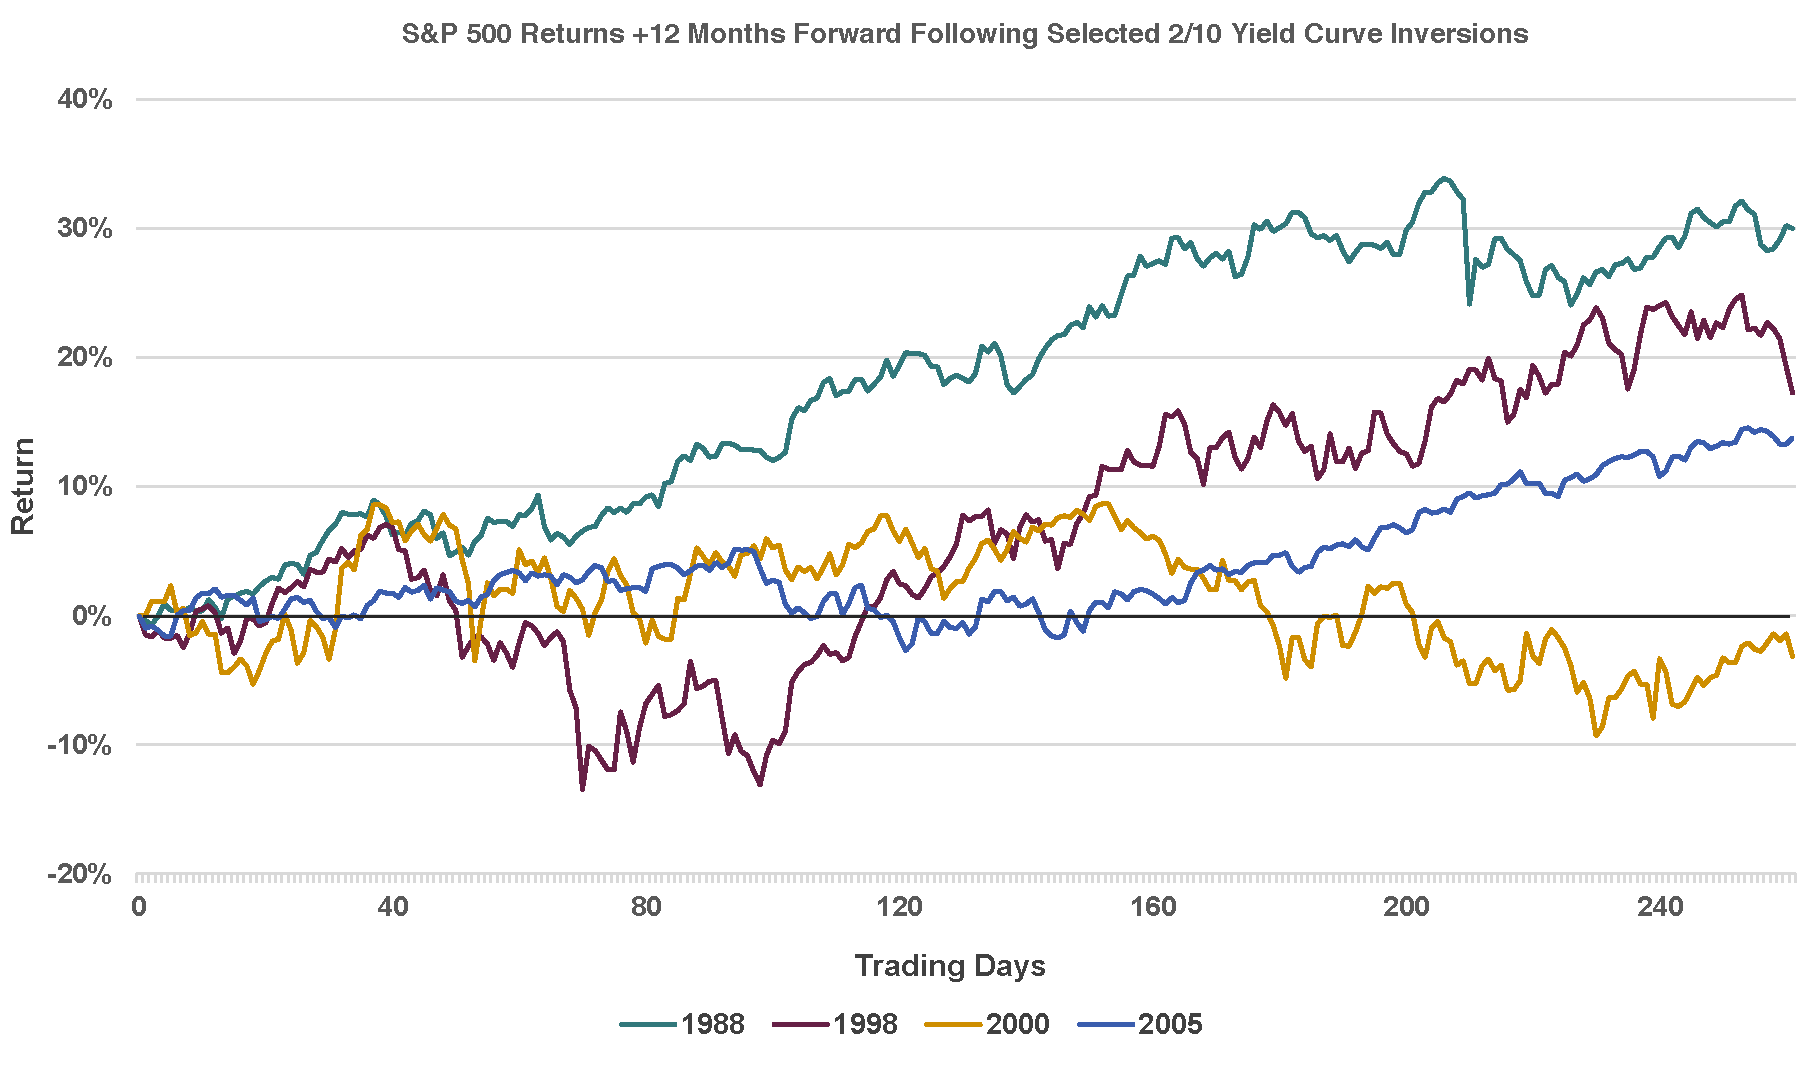
The graph shows multiple cases (1988, 1998, 2005) with positive returns in the 12 months following an inversion and one case (2000) with negative returns. The average of these four cases was a return of approximately 14%. While not shown on the graph, another instance of strong performance following an inversion occurred beginning in early 2006. After this inversion (from January 31, 2006 through October 9, 2007), the S&P 500 posted a cumulative gain of 26%. Of course, the market fell sharply after October 9th, but investors who sold out in early 2006 missed a very strong rise in prices. Even if this most recent sustained inversion signals a recession, timing the market based upon an inversion would be extremely difficult as evidenced by this graph.
Furthermore, timing the market based upon the prospect of a recession, regardless of inversion, is also risky as illustrated below.
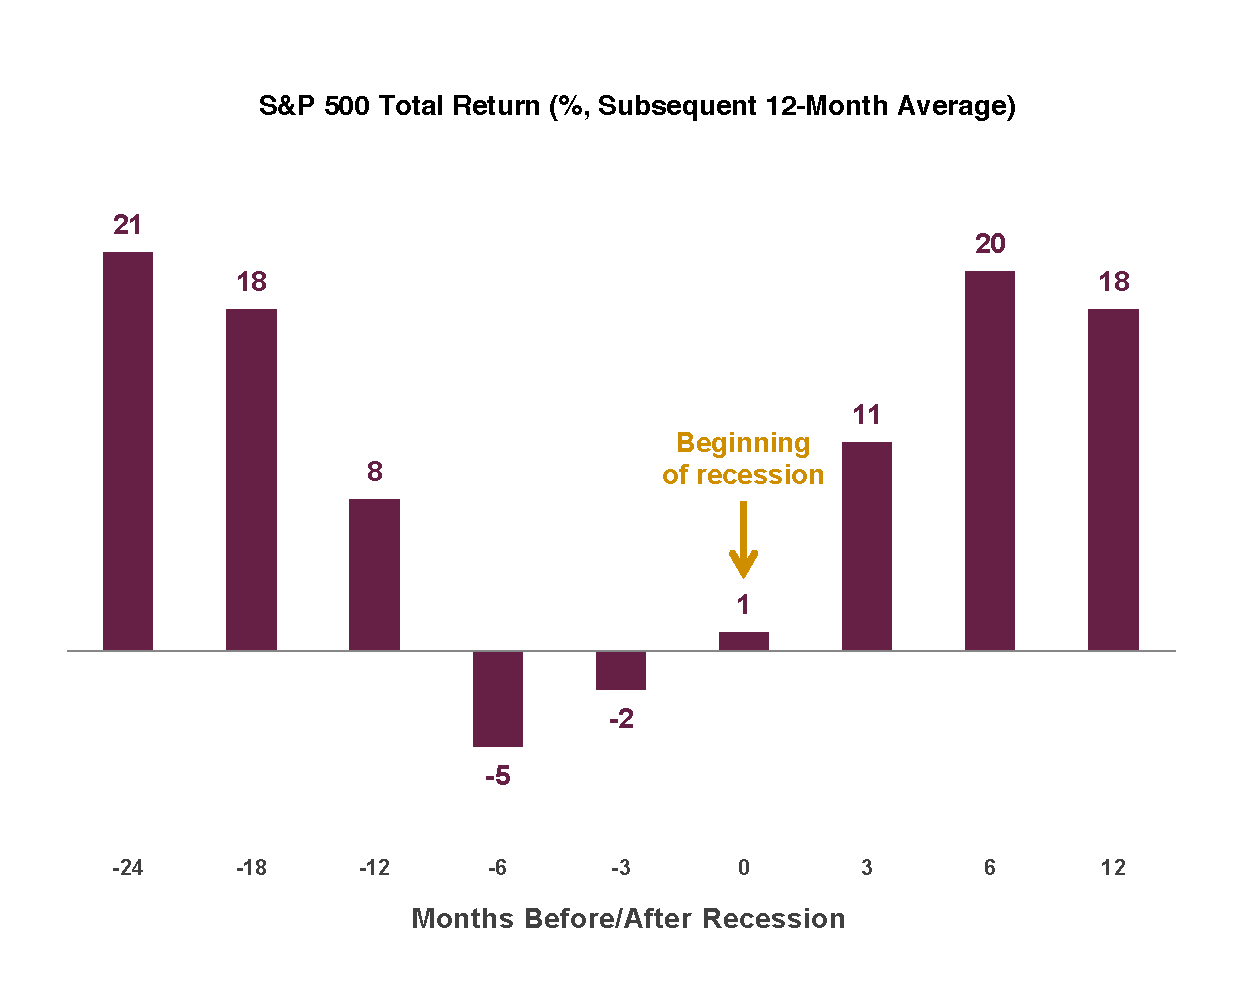
While the stock market typically turns down prior to a recession, the downturn is usually within roughly six months of the start of a recession. Again, investors who sell out too early (and especially too late) risk missing most of the market’s return.
Equities have been in a strong bull market for some time – by most accounts, the longest streak recorded – and many investors may be over-allocated to stocks. A more prudent way to trade this event is to look at current allocations and, if out of line, reallocate to your long-term target. Presumably, your target allocation was set with a clear mind, understanding that you have the ability to weather any storm as long as you maintain your investment plan.
The Big Lesson
Timing the market and trading around a recession can be extremely difficult. To benefit, an investor would have to time selling and then buying perfectly—without a crystal ball. A yield curve inversion may make for a good news story, but the track record of using it for investing is not very appealing.